Why Track Urban Expansion? 🌆
Urban expansion is one of the most visible indicators of economic growth, population increase, and infrastructure development. But while urbanization often brings opportunity, unchecked sprawl can create more problems than it solves. That’s why monitoring urban growth—especially through annotated satellite imagery and AI—is no longer optional. It’s essential.
Here’s why tracking urban expansion matters for cities and regions around the globe:
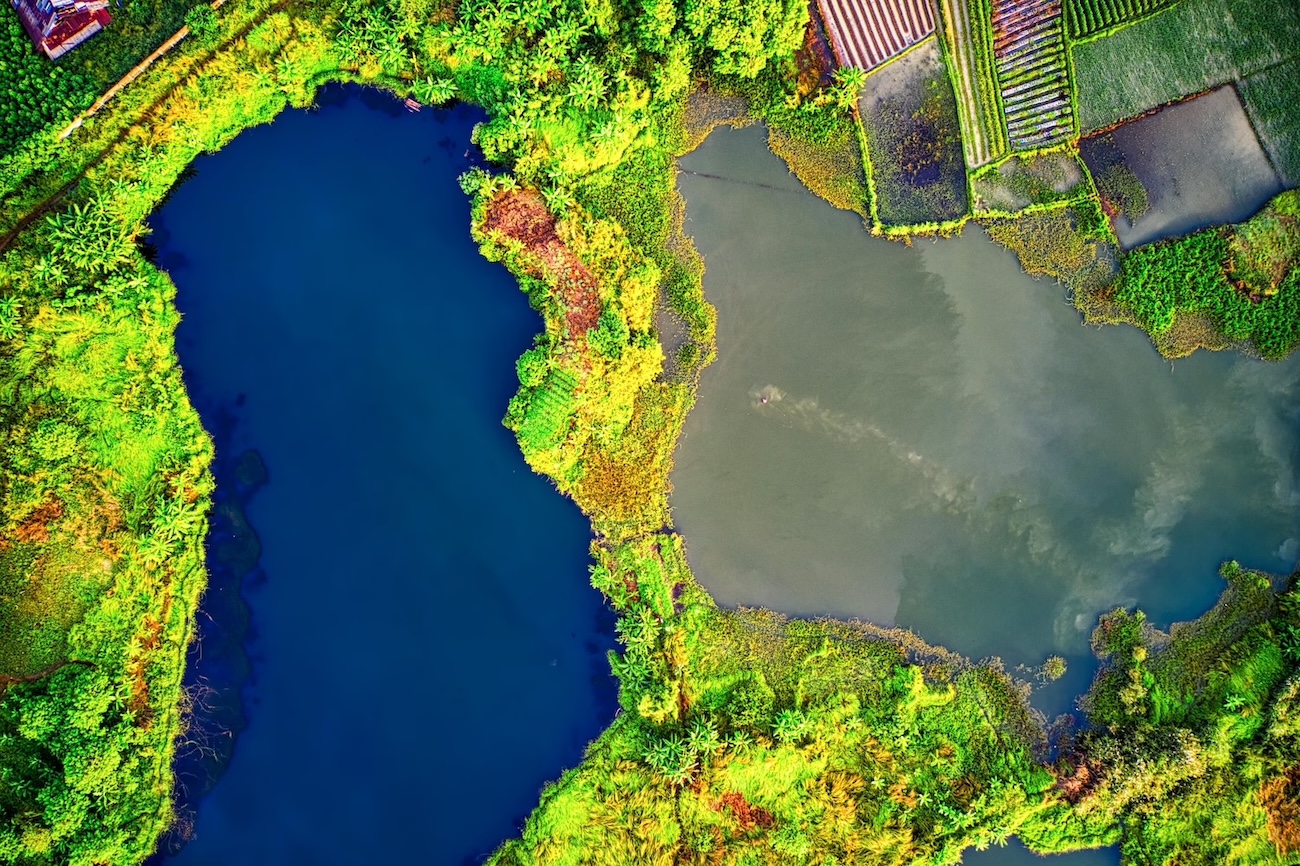
🌍 Environmental Stewardship
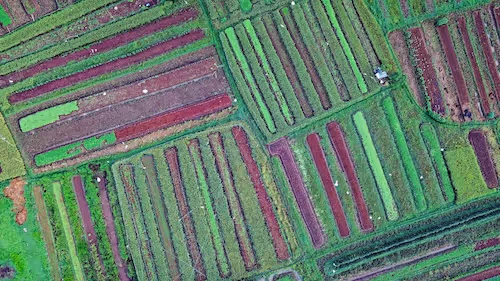
Unregulated construction frequently encroaches on forests, wetlands, and protected areas. Without real-time monitoring, illegal deforestation, habitat fragmentation, and wetland degradation can go unnoticed for years. Annotated satellite imagery helps detect land cover change early and enables authorities to act swiftly.
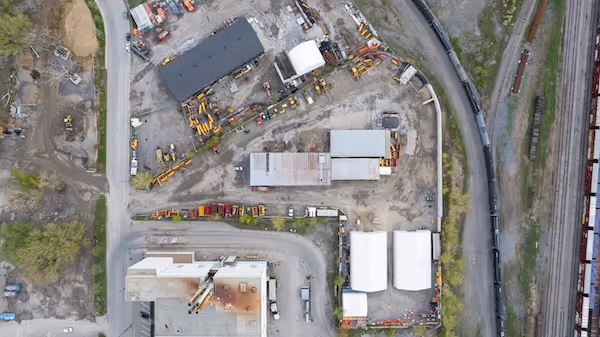
🏘️ Infrastructure and Public Services
As urban footprints grow, so does the need for expanded public services—roads, water, sewage, schools, and hospitals. But when urbanization outpaces planning, new settlements often lack access to basic utilities. With accurate data on where expansion is happening, urban planners can better forecast infrastructure needs and deploy resources strategically.
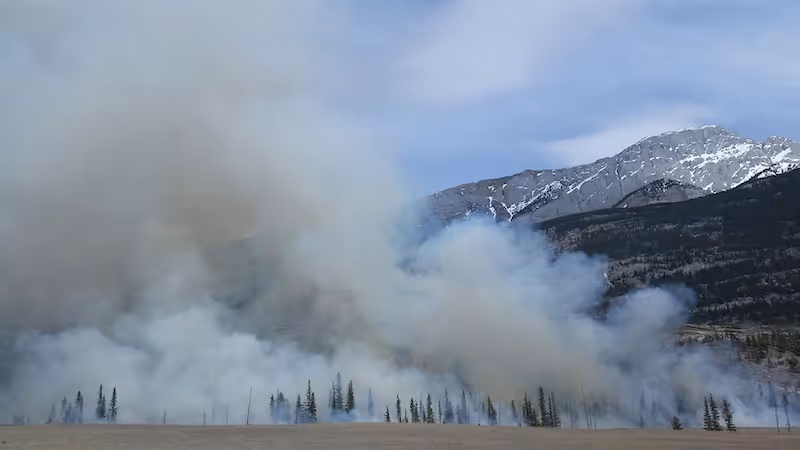
🚨 Disaster Risk and Resilience
In many fast-growing cities, informal settlements spring up in high-risk zones—such as floodplains, hillsides, or industrial corridors. Tracking urban growth helps identify these risk-prone developments. Combined with historical satellite data, AI models can support disaster preparedness by modeling flood risk zones or simulating urban heat islands.
📈 Economic and Social Policy
Understanding how a city expands reveals patterns of migration, affordability, and inequality. For example, if low-density suburban sprawl grows while central areas stagnate, it could indicate displacement due to housing costs. With the right annotation layers, governments can tailor social programs or subsidies to the right neighborhoods.
🔍 Transparency and Governance
Publicly available maps showing urban expansion increase transparency. They allow citizens, NGOs, and journalists to hold policymakers and developers accountable. When urban growth is annotated and visible, it becomes part of a public dialogue—leading to more inclusive and sustainable urban strategies.
🤖 AI + Satellite = Next-Gen Urban Planning
AI-powered analysis of satellite maps bridges the gap between raw earth observation data and actionable urban intelligence. What once took months via manual surveys can now be done in days—automatically, repeatedly, and with far greater geographic scope.
With annotated datasets as training inputs, AI models can detect not only where cities are expanding, but also how fast, in what directions, and what kind of growth (residential vs. industrial vs. informal). This creates a crucial feedback loop for future-proof city planning.
The Project at a Glance 📍
To showcase the real-world impact of annotated satellite imagery for urban AI applications, let’s examine a compelling case study that combined cutting-edge AI with precision human annotation.
🏙️ Context
The project focused on a sprawling metropolitan region in Southeast Asia, home to over 12 million people and growing rapidly. Over the past decade, the city had experienced massive transformation: farmland converted to gated communities, industrial zones doubling in area, and informal housing expanding in flood-prone peripheries.
But despite the scale of growth, urban data was fragmented, outdated, and largely disconnected from satellite observation tools. Policymakers relied on census figures and hand-drawn zoning plans, often two or more years behind.
That’s where this pilot project came in—with the ambition to fill the gap using high-frequency satellite imagery, annotated at scale, and interpreted with AI.
🧭 Objectives
The project was designed to meet four core goals:
- Map historical urban expansion from 2013 to 2023 using satellite archives
- Classify types of urban growth—formal, informal, residential, industrial, and transitional
- Automate detection of new developments and urban encroachment using AI
- Provide insights to guide zoning updates, infrastructure investment, and climate resilience planning
👥 Stakeholder Ecosystem
Collaboration was key. The project brought together:
- Government Planning Authorities: to ensure integration with local policy and zoning tools
- NGOs & Environmental Advocates: to monitor encroachments and biodiversity loss
- Urban Research Labs: for academic validation, model design, and publication
- Private Data Providers: to supply satellite images, licensing, and preprocessing support
- Annotation Experts: to manually label urban features, train models, and validate predictions
Each partner had a stake in the outcome—from shaping better policy to scaling research into deployable AI tools for smart cities.
🛰️ Data Sources and Timeline
The project utilized:
- Sentinel-2: offering high-resolution, multispectral images every 5 days
- Landsat-8: for historical backfill with consistent, open-access imagery
- OpenStreetMap (OSM): to align satellite observations with known roads and built features
- Municipal Datasets: including zoning maps and census blocks for ground-truthing
The analysis spanned 10 years and involved over 400 image tiles, filtered to reduce cloud contamination and seasonal bias.
🔍 Annotation Targets
Instead of generic “urban” labels, the project focused on a layered, fine-grained taxonomy:
- High-rise residential blocks
- Low-rise, planned housing developments
- Informal or unauthorized settlements
- Industrial parks and construction zones
- Mixed-use zones with green overlays (urban gardens, edge parks)
This granularity gave stakeholders not just a map of growth—but a map of meaningful growth, showing what kind of expansion was happening and where it deviated from planned patterns.
Why Satellite Imagery Is a Game Changer 🛰️
Unlike drone footage or ground surveys, satellite maps give a high-level, repeatable view of urban patterns over months or years. With free access from platforms like Copernicus or USGS Earth Explorer, cities around the world can:
- Analyze dense urban cores and peri-urban zones
- Detect encroachments into protected zones
- Track construction hotspots
- Compare historical expansion trends
Paired with annotated datasets, these visual records form the perfect training ground for AI models.
Annotation Strategy: Beyond the Bounding Box
Although we won’t dive into tool types here, it’s worth noting that annotating urban areas from satellite images requires more than simple labels. Urban footprints are:
- Irregular and multi-scale (from dense city blocks to informal settlements)
- Often visually similar to other land cover types (e.g., industrial zones vs. built-up villages)
- Layered over time (e.g., phased construction)
That complexity called for a segmentation-first approach, enriched with time-series metadata and localized urban planning guidelines.
Key Steps in the Annotation Pipeline 🛠️
1. Data Collection and Filtering
The team curated 400+ satellite images over a 10-year period, focusing on dry-season captures (to reduce cloud cover) with minimal haze.
Selection criteria included:
- At least 10m resolution
- Even spatial coverage of core and fringe zones
- Metadata on acquisition date and geolocation
2. Preprocessing
Satellite images were radiometrically and geometrically corrected. NDVI and NDBI indices were computed to separate vegetation and built-up regions.
This helped:
- Create clean masks for AI training
- Reduce annotation errors in transitional zones
3. Human Annotation (with Expert Verification)
DataVLab-style annotators outlined the precise boundaries of urban sprawl, drawing polygons around:
- Residential complexes
- Industrial developments
- Road expansions
- Informal settlements
Urban planners then reviewed edge cases—especially where building density was ambiguous or overlapped with farmland.
4. Class Definitions
Rather than treating urban as a single class, the model was trained to differentiate between:
- High-density urban
- Low-density urban
- Industrial areas
- Construction sites
- Vegetated urban mix
This multilabel taxonomy created a far more nuanced picture of urban development than generic “urban/non-urban” splits.
AI Model Architecture and Training 🧠
Approach Used
The project used a deep learning semantic segmentation model based on U-Net architecture with a ResNet-34 backbone, optimized for multispectral imagery.
Key points:
- Trained on combined RGB and near-infrared (NIR) bands
- Included temporal data to learn spatiotemporal patterns
- Weighted loss function to counteract class imbalance (e.g., sparse construction zones)
Data Augmentation
To mimic real-world variation, the following augmentations were applied:
- Random cloud overlays
- Rotation and flipping
- Noise injection
- Seasonal appearance variation using histogram matching
This enhanced the model’s robustness across geographic zones and satellite providers.
Ground Truth Validation and Results 📈
To assess the model’s accuracy, 10% of the annotated data was held out for testing. The AI predictions were then compared to manually verified annotations.
Performance Metrics:
- IoU for urban classes: 0.81
- F1-score (weighted): 0.87
- Pixel accuracy: 91.3%
In peri-urban zones, where confusion with vegetation is common, IoU dipped slightly (~0.75), but temporal features helped correct for seasonal variations.
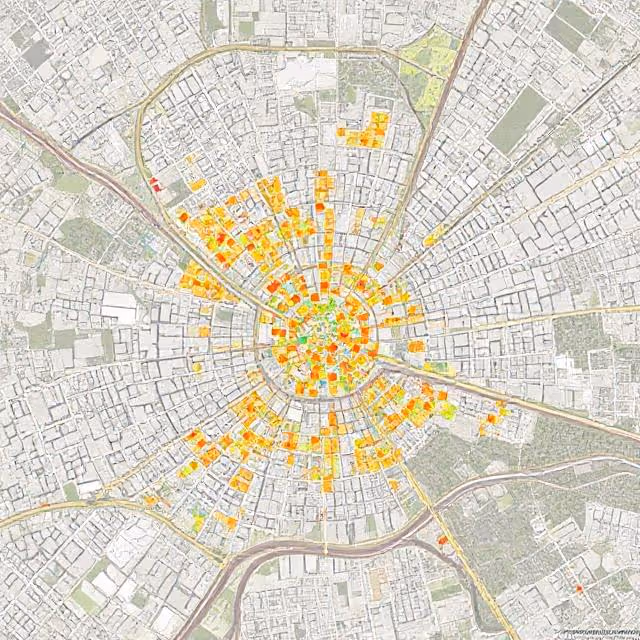
Detecting Urban Expansion Trends Over Time 🕰️
After training, the model was run on all yearly image batches. The result? A high-resolution heatmap showing:
- Net urban expansion by square kilometer
- Per-class growth (e.g., residential vs. industrial)
- Directional bias (e.g., northward vs. southward expansion)
The animated overlay of 10 years revealed critical insights:
- Informal settlements doubled in footprint near transportation corridors
- High-density zones grew radially until reaching natural barriers (e.g., rivers)
- Industrial zones showed leapfrogging growth patterns beyond planned areas
These outputs were exported into GIS dashboards for stakeholders to explore interactively.
From Insights to Urban Policy 🧭
The case study didn’t stop at visualization. It led to actionable outcomes:
- Urban planning authorities updated zoning maps to include newly classified residential clusters
- Environmental agencies flagged at-risk green zones now bordering expansion
- NGOs used the informal settlement data to advocate for utility service access
- The academic team published findings in an open-access journal on AI-for-urbanism
Furthermore, the annotated datasets (after anonymization) were contributed to open repositories to help other cities replicate the workflow.
Challenges and Workarounds ⚠️
Inconsistent Cloud Coverage
Even in curated images, cloud artifacts posed problems. The team:
- Used composite mosaics over multiple dates
- Trained the model to recognize and ignore cloud textures
Class Overlap
Differentiating construction zones from dense industrial rooftops proved tricky. Solution:
- Injected temporal context to detect newly changing areas vs. static industrial blocks
- Used auxiliary inputs like permit data when available
Annotator Fatigue
Labeling sprawling metro regions frame by frame is exhausting. They introduced:
- Micro-tasking and auto-suggestions from early model versions
- Break cycles and performance gamification
This increased annotation throughput by 35%.
Why This Matters for Smart Cities 🚀
Urban growth is accelerating in Asia, Africa, and Latin America. Without scalable tools to monitor and forecast expansion, cities risk chaotic sprawl.
This case study proves:
✅ AI can learn nuanced urban patterns
✅ Satellite imagery is a scalable, reliable source
✅ Human oversight ensures real-world accuracy
✅ Annotated data is the backbone of predictive urban planning
By investing in precise annotation and model training, cities can leapfrog traditional bureaucratic delays and adopt data-driven urbanism.
Let’s Build Better Cities Together 🌍
Whether you’re a public agency, urban planner, or researcher, annotated satellite data offers you a unique advantage in shaping smarter urban futures.
Want to explore how annotated imagery can support your next project?
👉 Let’s connect and build your AI-driven monitoring solution.