Why Sentinel-2 Matters for Crop Monitoring 🌍
Sentinel-2, part of the Copernicus program by the European Space Agency, is one of the most powerful open-access satellite systems for agricultural analysis. With a spatial resolution of up to 10 meters and frequent revisit cycles (every 5 days at the equator), it’s especially suited for monitoring changes in vegetation over time.
Key Sentinel-2 benefits for Agriculture include:
- Multi-spectral imaging across 13 bands (visible, near-infrared, and shortwave infrared)
- High temporal frequency to observe phenological stages
- Free, open-source data available via platforms like Copernicus Open Access Hub or Sentinel Hub
These capabilities allow AI teams to monitor crop development, predict harvest time, detect pest stress, and assess irrigation needs without deploying physical sensors on the field.
The Annotation Imperative: Turning Raw Data into Ground Truth
Sentinel-2 imagery, though rich in spectral information, lacks one vital component for training supervised machine learning models: semantic meaning. Each pixel reflects light, but without labels, AI can’t discern a wheat field from a soybean plot, or distinguish stressed vegetation from healthy crops. That’s where annotation comes in.
In the context of agricultural AI, annotation means mapping pixels to real-world crop classes across time and geography. It bridges the gap between raw remote sensing data and actionable agricultural intelligence, converting massive volumes of Earth observation images into labeled training sets.
From Spectral Data to Actionable Labels 🌐
To transform Sentinel-2 data into usable training samples, the team undertook a multi-layered annotation process that went far beyond mere classification:
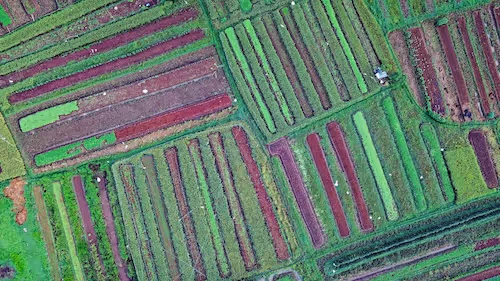
- Semantic Segmentation: Every pixel in a satellite tile was assigned a specific crop label. This was achieved through vector-to-raster conversion of geospatial crop maps, producing high-resolution masks.
- Temporal Synchronization: Since crop growth evolves over time, static imagery often leads to poor classification. Annotators aligned each image with crop development phases using local phenology data and multi-date acquisition strategies.
- Spectral Index Mapping: Indices like NDVI, NDWI, and EVI were calculated and stacked alongside raw bands, enhancing spectral distinction. These calculated bands became part of the annotation, especially when subtle class differences (e.g., maize vs. sorghum) were involved.
- Label Quality Assurance: Each annotation was evaluated for consistency, using field reports, known phenological curves, and machine-inferred outlier detection (e.g., if NDVI drops mid-season, it might signal annotation error or pest impact).
Balancing Precision and Scale
One of the hardest tasks in this project was reconciling the need for high-resolution, pixel-level accuracy with the sheer volume of data from Sentinel-2. The team had to annotate tens of thousands of square kilometers while keeping spatial precision intact.
This was solved by introducing a hybrid annotation workflow, blending manual validation with automated GIS processes:
- For well-documented regions like France or Germany, national LPIS data provided highly reliable crop maps, which were easily rasterized.
- In under-documented zones like parts of Argentina or Brazil, annotators relied on a mix of MODIS-based classification, Sentinel-2 NDVI time series, and local expert reviews.
- Edge cases and inconsistencies were flagged for review by agronomists or escalated through a semi-automated quality assurance pipeline.
Ultimately, each labeled patch wasn’t just an image — it was a data-rich snapshot, annotated with crop type, date, season stage, spectral metadata, and geographic coordinates. These attributes were essential for ensuring model generalization and temporal transferability.
Building the Annotation Pipeline: From Pixels to Patterns
Creating a scalable annotation system for satellite imagery isn’t like labeling bounding boxes on street images. It requires a thoughtful pipeline with several stages of preprocessing, validation, and harmonization.
Here’s how the annotation workflow was structured:
🛰️ 1. Curating Sentinel-2 Data
The process began with downloading Level-2A Sentinel-2 imagery—corrected for atmospheric distortions—for selected agricultural zones. The team prioritized scenes during key crop growth phases: early season (emergence), mid-season (peak growth), and pre-harvest.
To ensure data quality, only images with less than 5% cloud cover were retained. Cloud masking was further enhanced using the SCL (Scene Classification Layer) and additional Sen2Cor preprocessing.
🗺️ 2. Aligning Ground Truth Maps
Authoritative crop maps from national agricultural databases and NGO surveys (such as LPIS) were overlaid on Sentinel-2 tiles using GIS tools.
These shapefiles were rasterized to match Sentinel-2 resolution. Each pixel received a crop type ID if it intersected with ground truth polygons — resulting in semantic segmentation masks compatible with model training.
🔍 3. Spectral Index Calibration
Rather than just working with raw bands (B2 to B12), the team computed vegetation indices like:
- NDVI (Normalized Difference Vegetation Index)
- EVI (Enhanced Vegetation Index)
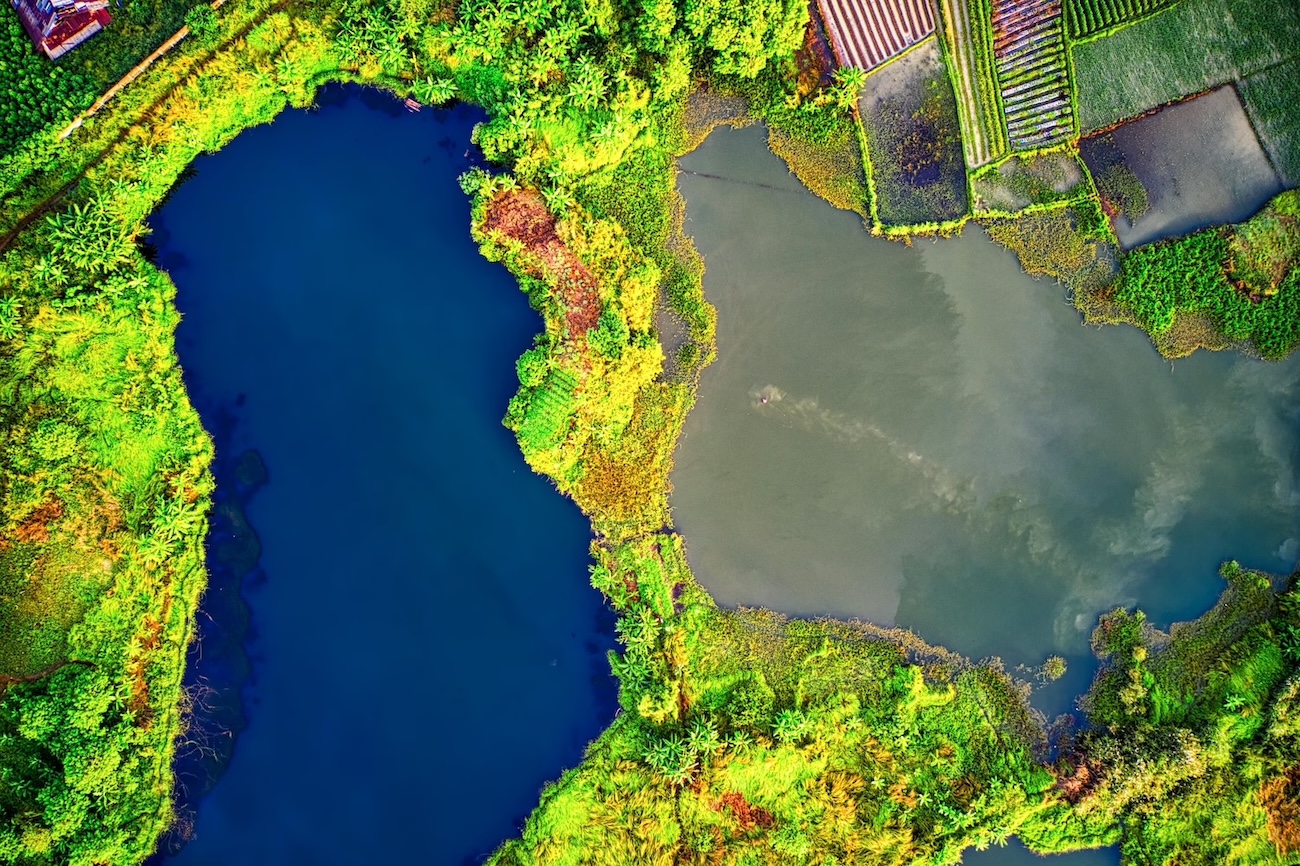
- NDWI (Normalized Difference Water Index)
These indices were stacked as additional channels in the annotation files, improving class separability during training.
🔄 4. Temporal Aggregation
Given Sentinel-2’s frequent revisits, the team implemented a temporal stacking strategy — combining multi-date imagery into composite tensors. Each annotated patch represented not a single timestamp but a time series (e.g., 5 dates across a season).
This enriched the model’s ability to detect subtle phenological differences between crops.
Tackling the Unique Challenges of Satellite Annotation 🧩
Annotation in remote sensing comes with a specific set of hurdles, each requiring tailored solutions:
☁️ Cloud and Shadow Interference
Despite filtering cloudy images, thin cirrus clouds and cast shadows can corrupt spectral readings. To mitigate this:
- A custom cloud probability mask (based on the FMask algorithm) was applied.
- Patches with persistent cloud cover (>40%) were automatically discarded from the training dataset.
🧭 Label Noise in Ground Truth
Ground truth crop maps, especially in developing regions, were often outdated or coarsely drawn. The team used visual inspection on NDVI curves and field reports to validate questionable polygons.
In borderline cases, ambiguous pixels were labeled as “Unknown” and excluded from training.
🌍 Geographic Variability
Wheat in France grows differently than wheat in Argentina. To ensure geographic robustness, the dataset was split into:
- In-region training and testing (within one country)
- Out-of-region validation (model trained in one country, tested in another)
This cross-validation approach helped assess generalization capacity — a critical KPI for scalable agricultural AI.
Real-World Results: AI-Powered Crop Monitoring in Action
The annotated Sentinel-2 dataset laid the foundation for training robust, multi-season crop classification models capable of supporting real-time decision-making across continents. Once annotation was complete and the training pipeline optimized, the results were both technically impressive and agriculturally impactful.
Performance Highlights
Using a deep convolutional neural network with a U-Net backbone and temporal attention layers, the model achieved:
- 92.3% Mean Intersection over Union (mIoU) for in-region classification of wheat, maize, and soy — meaning the AI accurately mapped crop fields at pixel-level resolution across training zones.
- 84.1% accuracy on completely out-of-region testing (trained in Europe, tested in South America), showcasing strong generalization.
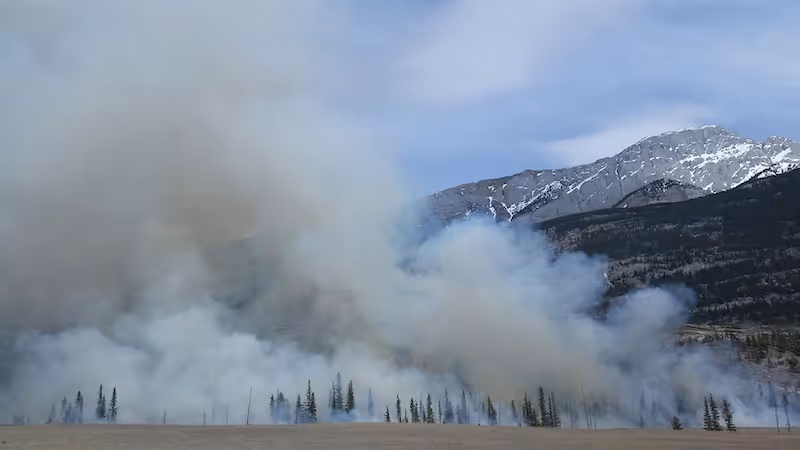
- High recall rates (>90%) for early-stage growth detection, essential for early warning systems in case of pest outbreaks or water stress.
- Rapid inference time, allowing model deployment across entire provinces or countries in hours rather than days.
These results outperformed traditional remote sensing classification methods, which often relied on unsupervised clustering or limited phenological indices without pixel-level supervision.
Real-World Deployments 🌍
Several deployments followed across geographies, institutions, and use cases:
- In Argentina, the Ministry of Agriculture used the system to track soybean development in Córdoba. The model accurately detected delayed emergence in drought-affected zones weeks ahead of human surveyors.
- In France, a regional cooperative in Occitanie leveraged the system to monitor wheat nitrogen stress using NDVI trends, reducing fertilizer use by 12% without impacting yield.
- In India, the model was integrated into an NGO platform that supports smallholder farmers. By mapping cropping patterns in Punjab and Telangana, it enabled more accurate yield forecasts and informed state-level procurement policies.
Each case demonstrated not just accuracy, but practical utility — the annotated dataset made AI models more transparent, more adaptable, and far more useful in real-world agricultural contexts.
Visual Verification and Confidence Maps
To increase farmer and policymaker trust, the system included confidence heatmaps alongside its predictions. These maps were derived from softmax outputs and compared to manually annotated zones for spot-checking.
High-confidence predictions helped prioritize which alerts to act on, while low-confidence areas flagged uncertain data, often due to cloud shadows, crop rotation, or mixed land-use boundaries.
This visual feedback loop encouraged collaborative AI, where human agronomists and farmers could validate and improve model predictions on the ground — a virtuous cycle of annotation → training → feedback → reannotation.
Impact on Yield Forecasting and Sustainability 📊
Perhaps the most compelling impact was on agricultural forecasting and sustainability reporting:
- The AI system reduced the need for monthly field visits by 60–70%, cutting carbon emissions from vehicle-based surveys.
- Forecasts using AI outputs aligned within ±5% of actual yield reports for wheat and maize across three seasons.
- The platform enabled early detection of yield loss due to water stress, helping cooperatives and insurers plan better resource distribution.
In summary, the carefully annotated Sentinel-2 dataset enabled AI to not only recognize crops but anticipate risks — elevating agricultural monitoring from passive observation to predictive intelligence.
Lessons Learned and Takeaways for Future Projects 📌
This case study underscores several important learnings for any team planning to annotate Sentinel-2 imagery for agricultural AI:
✔️ Prioritize Cloud-Free Temporal Windows
Seasonal composites reduce annotation errors and enrich model learning. Use smart filtering to eliminate irrelevant timestamps.
✔️ Validate Ground Truth Diligently
Do not blindly trust all shapefiles — especially in emerging regions. Combine official maps with field reports or visual indicators.
✔️ Embrace Multi-Date Context
Crop development is a process, not a frame. Annotating time series leads to more robust AI models.
✔️ Balance Quantity with Diversity
More patches help, but spatial diversity matters more. Annotate across climates, soil types, and farming practices.
Bonus Insight: Integration with Crop Calendars 📆
To refine both annotation quality and AI performance, the team used regional crop calendars from sources like FAO’s GIEWS to time their dataset curation.
This avoided mislabeling periods where multiple crops might share similar spectral signatures and focused on phenological peak phases when differences are clearer.
What’s Next? Scaling Up with Automated Labeling Pipelines 🚀
Manual annotation of Sentinel-2 imagery is powerful but time-consuming. The next frontier involves using weak supervision and self-supervised learning to scale further.
Techniques like:
- Using pre-trained models to pseudo-label unlabeled regions
- Training AI to recognize temporal vegetation patterns unsupervised
- Combining Sentinel-2 with PlanetScope or drone imagery for hybrid annotation transfer
…can dramatically accelerate the creation of robust, geospatially aware crop monitoring systems.
Let’s Talk About Your Use Case 🌱
Working on a precision agriculture solution or satellite-AI integration? Whether you're developing AI models or building smart farming platforms, annotated Sentinel-2 imagery can be the game-changer you need.
📩 Ready to take your AI pipeline to the next level with expertly labeled satellite data? Get in touch with our team at DataVLab to start your journey.