Why Annotating Flood Zones from Satellite Imagery Matters 🌊
Floods are among the costliest and deadliest natural disasters globally. According to the World Resources Institute, more than 250 million people are affected annually, with damages exceeding billions. Satellite imagery has emerged as a reliable, timely, and scalable way to detect and monitor flood events. But raw images aren’t enough—annotated data is essential to train AI models that can understand what’s happening on the ground.
The Role of AI in Flood Detection
Machine learning, especially deep learning models like convolutional neural networks (CNNs), can process high-resolution satellite images to detect flooded areas, identify infrastructure damage, and forecast future flood risks. These models require annotated datasets showing pre- and post-disaster imagery, with precise boundaries of flood zones.
Without clean, well-labeled data, models risk underperforming or making critical errors during real-time disaster scenarios.
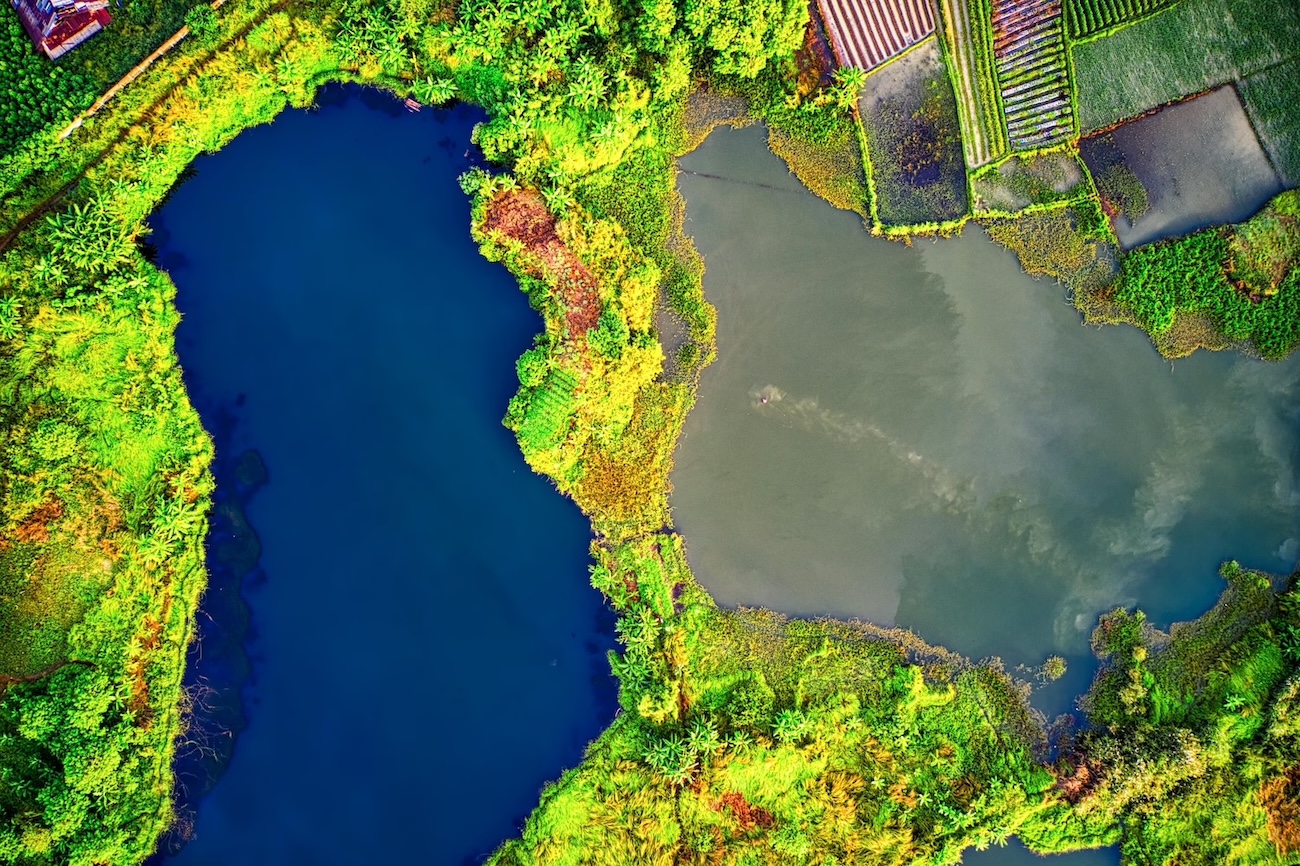
What Makes Flood Zone Annotation So Challenging?
Annotating flood-affected regions isn’t a simple “water vs. not-water” classification. Satellite images may present:
- Cloud cover or haze during storms
- Obstructed visibility due to vegetation
- Reflections and false positives from urban surfaces
- Changes in water levels over time
- Mixed pixels near shorelines or muddy water
These factors demand careful human judgment and contextual understanding. For instance, a muddy field might resemble a shallow flood but may not be hazardous. Annotators must be trained to identify patterns that align with flooding, not just wet surfaces.
Furthermore, flood impacts vary across geographies. An urban flood in Jakarta looks dramatically different from a river flood in Bangladesh or a hurricane aftermath in New Orleans. Local topography, infrastructure, and seasonal changes all influence how flood zones manifest in satellite images.
Labeling Strategies for Flood Zones
To ensure high-quality datasets, professionals follow a combination of visual analysis, metadata integration, and contextual cues. Here’s how to approach it:
Use Multi-Temporal Imagery
One of the most powerful techniques is comparing “before and after” satellite imagery. This helps highlight water encroachment areas, identify submerged infrastructure, and validate the extent of the flood. Tools like Sentinel Hub and NASA Worldview offer near-real-time access to such data.
Overlaying both timeframes allows annotators to pinpoint new water bodies that didn’t exist before the event.
Combine Visible and Infrared Bands
Flood waters can sometimes be obscured in standard RGB imagery. Near-infrared (NIR) and short-wave infrared (SWIR) bands are particularly useful:
- NIR helps identify vegetation stress or loss
- SWIR distinguishes between wet and dry soil more accurately
Using these spectral bands provides additional confirmation and reduces ambiguity. Platforms like Google Earth Engine allow combining multiple bands for better visualization.
Understand Contextual Indicators
Flooded areas tend to correlate with:
- River overflow zones
- Coastal storm surges
- Low-lying terrain in digital elevation models (DEM)
- Areas near damaged levees or drainage systems
Bringing in GIS layers—such as hydrological maps or terrain slope models—can significantly boost annotation accuracy.
Going Beyond Floods: Other Natural Disasters
Flood annotation is just one part of a broader effort to train AI models on disaster detection. Other natural events, such as wildfires, landslides, hurricanes, and volcanic eruptions, also benefit from satellite Image Annotation. Each brings its own challenges and labeling logic.
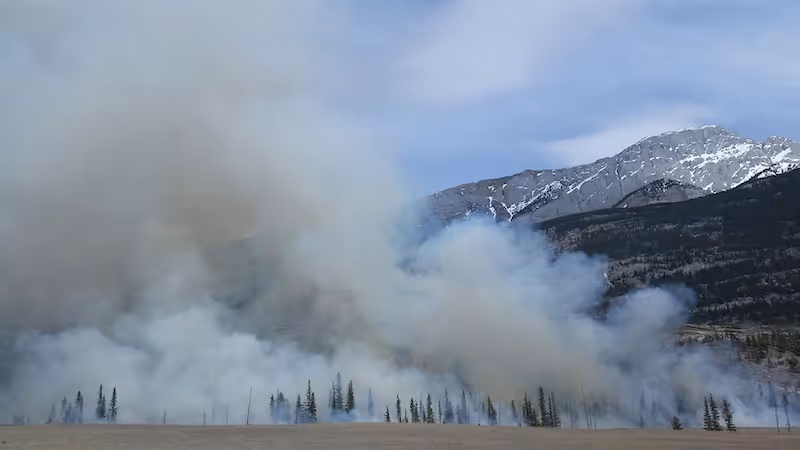
Wildfires 🔥
In wildfire detection, annotation often involves labeling burn scars, active flames (from thermal sensors), and smoke plumes. Multispectral imagery is crucial, especially in identifying burn severity.
Landslides 🏔️
Landslide annotation is particularly complex due to subtle terrain shifts. Annotators must detect slope changes, debris trails, and sediment patterns, often requiring LiDAR or DEM overlays.
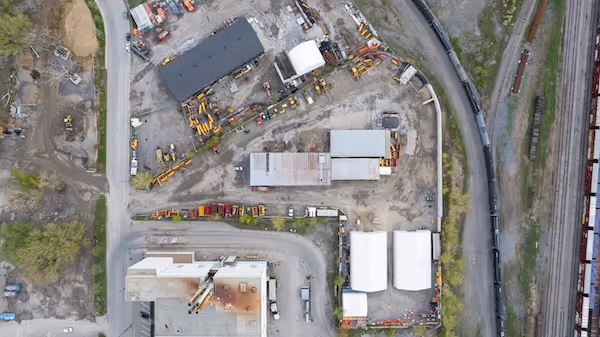
Hurricanes and Storm Damage 🌀
High-resolution post-event imagery helps label destroyed buildings, blocked roads, and flooded zones. These annotations feed into post-disaster damage assessments and urban recovery models.
Use Cases That Rely on Accurate Annotations
Well-labeled datasets directly power numerous real-world applications. Let’s explore some key examples.
Emergency Response & Real-Time Monitoring
Annotated imagery allows emergency agencies like UN-SPIDER or FEMA to make informed decisions quickly. AI systems can:
- Predict flood trajectories
- Map evacuation zones
- Identify isolated communities
- Prioritize infrastructure repairs
Insurance and Risk Assessment
Companies like Swiss Re use satellite-derived insights to assess flood risk and process claims. Annotated flood maps help:
- Evaluate before/after damage
- Automate claim validation
- Price flood insurance dynamically
Urban Planning and Infrastructure Protection
City planners use annotated flood data to:
- Design flood-resilient infrastructure
- Retrofit drainage systems
- Update zoning laws
- Avoid construction in high-risk zones
Climate Modeling and Research
Long-term annotation datasets support global research initiatives like NASA’s SERVIR program or Copernicus Emergency Management Services. These datasets feed hydrological models that simulate:
- Rainfall-runoff patterns
- Coastal erosion
- Glacier melt-driven floods
Best Practices for High-Quality Flood Zone Annotation
Precision and consistency are essential when labeling flood zones and disaster impacts from satellite imagery. A small annotation mistake can cascade into significant model errors, especially in critical applications like evacuation planning or insurance assessment. Below is a deeper dive into essential best practices for flood zone annotation:
Leverage High-Resolution and Multi-Sensor Data
- Use the highest spatial resolution available (e.g., 30cm–1m per pixel) from providers like Maxar or Airbus, especially for urban floods.
- Incorporate radar-based sensors like Sentinel-1 (SAR), which penetrate clouds and are particularly helpful during ongoing storms or when optical images are obscured.
- Compare multi-sensor imagery (optical + SAR) to confirm water extents under varying conditions.
Annotate Across Different Temporal Snapshots
- Annotate images across various timestamps: before, during, and after the flood event.
- Use time-lapse analysis to track how flood waters evolve spatially and temporally. This is particularly useful in training models to recognize progression patterns.
- Make sure annotations are consistent across timeframes—this continuity is crucial for time-series AI models.
Incorporate External Data Layers
- Overlay Digital Elevation Models (DEMs) to determine natural flood pathways and low-elevation risk zones.
- Integrate hydrological data from sources like the Global Runoff Data Centre (GRDC) or local water authorities.
- Include shapefiles of rivers, canals, coastlines, and levees from GIS datasets to contextualize water movement.
Define Annotation Protocols in Advance
- Set clear definitions for what constitutes a flooded area (e.g., pooled water, submerged roads, or water-induced soil saturation).
- Establish class taxonomies for flood severity (e.g., shallow, moderate, severe) and for object-level annotations like roads, homes, and fields affected.
- Ensure all annotators are aligned with these standards using a guideline document or annotation manual.
Prioritize Review and Quality Assurance
- Implement multi-pass reviews: first-pass labeling by annotators, followed by expert or senior validator review.
- Use inter-annotator agreement metrics to assess consistency between labelers.
- Incorporate feedback loops, where model predictions are used to improve human annotation in areas of ambiguity or disagreement.
Use a Tiered Labeling Strategy
- Begin with broad semantic segmentation of flooded zones.
- Follow up with instance-level labeling (e.g., flooded buildings, blocked roads) to train more granular models.
- If resources allow, include bounding boxes or polygons for affected assets to enable object-specific predictions.
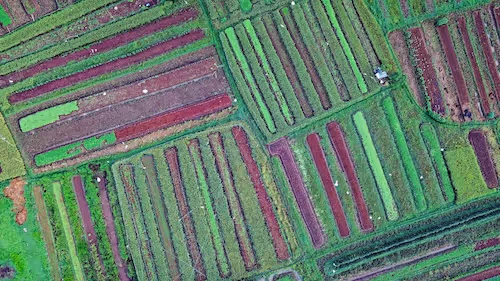
Factor in Seasonal and Geographic Variability
- Water visibility and terrain patterns change across seasons and regions. Annotators must be aware of seasonal flooding patterns (e.g., monsoon-driven in India vs. flash floods in the U.S.).
- Train your annotation team to recognize regional water features (e.g., rice paddies vs. floodwater) and typical seasonal vegetation patterns that may be misleading.
Maintain a Clean Data Structure
- Ensure consistent file naming, folder hierarchies, and metadata tagging.
- Save annotations in standardized formats (GeoJSON, COCO, or custom GIS-compatible formats) with clear spatial referencing.
- Store all source metadata (e.g., acquisition date, sensor, resolution, cloud cover %) alongside images and annotations.
Real-World Annotation Projects to Learn From
A number of large-scale geospatial annotation initiatives have laid the groundwork for flood and disaster-related AI research. These projects not only offer inspiration but also provide open-source datasets, protocols, and learnings that you can build upon.
xView2 by DIU and Carnegie Mellon
xView2 is a globally recognized benchmark dataset focused on post-disaster building damage assessment using satellite imagery. What makes it valuable:
- Includes over 1 million labeled buildings across multiple disasters: floods, hurricanes, wildfires, and earthquakes.
- Offers multi-class damage categorization (no damage, minor, major, destroyed).
- Combines before and after imagery with geographic diversity.
- Frequently used to evaluate AI models in real-world challenge settings such as the xView2 competition.
Takeaway: Their protocol of classifying building damage post-disaster can be adapted to flood zone severity classification (e.g., affected vs. submerged).
FloodNet by University at Buffalo and NASA
FloodNet is a collaborative research effort that builds real-time flood detection pipelines using satellite and crowdsourced imagery.
- Combines satellite, drone, and social media data to map floods in urban environments.
- Supports fine-grained flood mapping at street level, crucial for localized disaster response.
- Utilizes deep learning models trained on annotated flood data from recent hurricanes and flash floods.
Takeaway: FloodNet illustrates how hybrid data sources (e.g., drones + satellites) can enhance annotation strategies, especially in cluttered or urban zones where satellite visibility is limited.
Global Flood Database by Cloud to Street and NASA
This open-access Global Flood Database maps more than 900 flood events from 2000–2018 using MODIS and Landsat data.
- Covers 14 million km² of flooded area worldwide.
- Annotates floods based on thresholding water extent from time-series satellite data.
- Has been used to train global flood prediction models and validate disaster exposure statistics for development banks and climate researchers.
Takeaway: Longitudinal, standardized annotations like these allow for trend analysis and the training of flood risk forecasting models. This database sets the standard for temporal consistency in flood labeling.
NASA's Earth Science Disasters Program
The NASA Disasters Program collaborates with response agencies to provide annotated satellite products during global disasters.
- Offers annotated flood maps using SAR (Sentinel-1, ALOS-2) and optical (Landsat, MODIS) data.
- Teams with FEMA, USAID, and international agencies during emergencies.
- Annotation maps are shared publicly via NASA Worldview, often within 24–48 hours of events.
Takeaway: Shows the operational value of timely annotations and the need for semi-automated pipelines that produce usable disaster maps at scale.
Sentinel Asia Emergency Response Project
Managed by the Asia-Pacific Regional Space Agency Forum (APRSAF), Sentinel Asia provides geospatial disaster support for Asian countries.
- Integrates multi-sensor satellite data for floods, landslides, wildfires, and volcanoes.
- Relies on both professional analysts and volunteer annotation teams.
- Maps are used by national disaster authorities for immediate planning.
Takeaway: Demonstrates the importance of multilingual and culturally sensitive annotation protocols, especially in multi-country collaborations.
Other Projects Worth Exploring
- OpenAerialMap – Open-source aerial imagery used for disaster annotation.
- HOT Tasking Manager – Crowd-powered annotation platform used after major disasters (e.g., earthquakes, cyclones).
- Radiant MLHub – Hosts annotated geospatial datasets, including flood detection corpora.
The Role of Crowdsourcing in Disaster Annotations
Platforms like Zooniverse and Tomnod (archived) have successfully mobilized crowds to annotate flood extents during major disasters.
In the aftermath of Hurricane Harvey or Cyclone Idai, volunteers helped rapidly classify flooded buildings, roads, and zones. While professional annotation teams maintain higher precision, crowdsourcing excels in:
- Speed during crisis
- Geographic coverage
- Building initial datasets
Combining expert review with crowd-annotated data creates a hybrid model that balances speed with quality.
Elevating Annotation with AI-Assisted Tools 🤖
While this article avoids focusing on tools per se, it’s worth noting that semi-automated workflows are revolutionizing disaster annotation. AI-assisted segmentation, change detection algorithms, and active learning pipelines can:
- Reduce manual annotation time
- Highlight anomalous zones
- Suggest label corrections
- Improve consistency across large-scale datasets
Such tools are especially useful when working with high-resolution satellite imagery covering hundreds of square kilometers post-disaster.
Getting Stakeholders Aligned
Annotated satellite data plays a role across a broad ecosystem. Stakeholders include:
- Government agencies for disaster preparedness
- NGOs for relief planning
- Insurance companies for claims validation
- Academia for climate research
- Private sector for infrastructure monitoring
To maximize impact, annotation projects should define objectives clearly and involve cross-sector collaboration from day one.
This ensures that the dataset format, severity granularity, and geographic scope match the intended AI or operational use case.
Let’s Bring It All Together 💡
Accurate annotation of flood zones and natural disasters from satellite imagery is more than a technical challenge—it’s a human, environmental, and societal imperative. Whether you're enabling AI-driven crisis response, shaping long-term climate strategies, or building better insurance products, the first step is building trustable labeled data.
In a world where every hour matters during a disaster, annotated satellite images can save lives, safeguard communities, and inform resilient planning.
Ready to Annotate Smarter? Here's Your Next Step 🚀
Looking to outsource high-quality annotation for flood and disaster imagery? Or perhaps you’re building your own annotation pipeline and need support? At DataVLab, we specialize in geospatial annotation for AI teams working on climate, Agriculture, and satellite use cases.
👉 Let’s turn raw data into real impact. Reach out to our team for expert annotation services tailored to your mission.