Why Annotated Drone Imagery is a Game-Changer for Corn Health Monitoring 🌱
Agriculture is undergoing a quiet revolution. With growing pressure to increase yield, reduce resource waste, and minimize environmental impact, farmers are turning to precision agriculture powered by AI. And at the center of this transformation? High-resolution drone imagery—especially when paired with accurately annotated data.
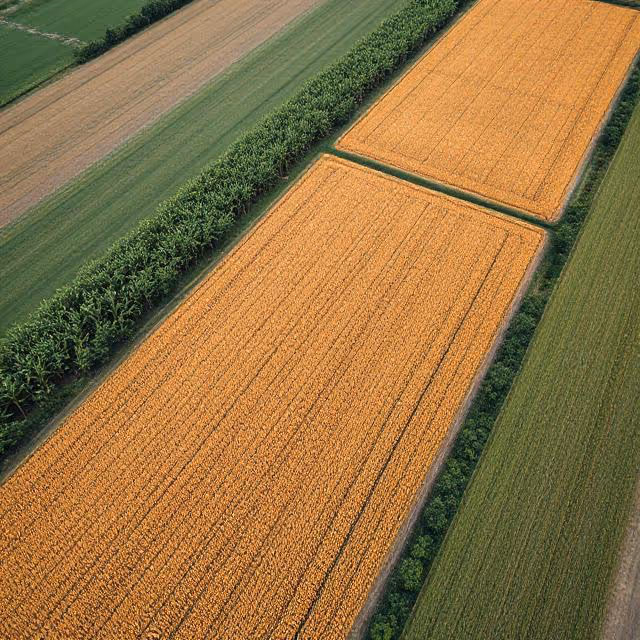
When it comes to corn field health, every pixel matters. Drone imagery offers a bird’s-eye view of potential threats—pest infestation, disease outbreaks, water stress, and nutrient deficiencies—but it’s the annotations that give these images meaning. Labeling sections of a corn field based on chlorosis, canopy density, or disease symptoms transforms raw images into actionable intelligence.
This case study dives deep into a real-world project where annotated drone imagery was used to enhance the monitoring and management of corn crops across several farms in the Midwest.
Project Overview: The Quest for Field-Level Precision 📍
The initiative began with a simple, yet ambitious goal: use drone-acquired aerial imagery to detect signs of crop stress early and at scale. Our partners—a network of agronomists, farmers, and a data science team—wanted to reduce unnecessary pesticide and water use, while maximizing corn yield.
To achieve this, we needed to:
- Capture multispectral drone images over key growth stages
- Label image data with agronomically meaningful classes (e.g., "chlorotic leaf area", "healthy canopy", "bare soil")
- Train AI models to analyze and predict crop health trends
- Deliver results via a dashboard for actionable insights at the plot level
This pipeline demanded not only technical skill but domain-specific knowledge—blending computer vision, Data Labeling, and plant pathology.
Data Collection Strategy: Flying Smarter, Not Just More 🛩️
One of the most overlooked elements in drone-based AI pipelines is not how much data you collect, but how intelligently you collect it. Early agricultural drone deployments often defaulted to "brute force" strategies—covering as many hectares as possible, as frequently as possible. But we quickly learned that smarter flight planning can lead to better model performance, reduced storage costs, and more insightful predictions.
Here’s how we approached intelligent drone deployment for this corn health annotation project:
Prioritized Growth Phases
Instead of evenly spaced flights, our schedule was weighted around critical corn growth stages: V4–V6 (vegetative), VT–R1 (tasseling and silking), and R3–R5 (kernel development). These windows are when nutrient uptake peaks, diseases emerge, and canopy stress becomes visible.
🧠 Insight: Flights during these biologically meaningful stages yielded annotations with greater downstream value, especially for detecting early stress and forecasting yield.
Stratified Sampling Across Microclimates
Fields weren't treated as uniform surfaces. We used satellite data and historical yield maps to divide each field into microzones. Some areas were more prone to water retention, others to nutrient loss or fungal outbreaks. Drones were assigned to fly at higher frequency over these high-risk zones, gathering more data where variability mattered most.
Multisensor Payload Optimization
Each drone carried both RGB and multispectral cameras (including Red Edge and NIR), which enabled post-processing into:
- NDVI (Normalized Difference Vegetation Index) for chlorophyll content
- NDRE (Red Edge NDVI) for nitrogen status
- Canopy Temperature Maps via thermal overlays
- 3D Canopy Height Models from overlapping frames
Combining these data streams enabled annotation teams to identify subtle stress patterns that a single-sensor approach would miss. For example, a chlorotic area with unchanged canopy height might indicate a nitrogen deficiency rather than stunted growth.
Efficient Flight Paths via AI Preprocessing
To reduce energy consumption and flight time, we used AI-driven flight path optimization. Instead of sweeping grid patterns, drones flew variable-altitude, priority-based paths, focusing first on zones flagged by low NDVI or historical pest issues. This made each flight more efficient and maximized the ROI of airborne data collection.
Timing and Light Calibration
Drone images can be heavily affected by sun angle, cloud cover, and even wind. We incorporated real-time weather API integrations to automatically delay or advance missions based on forecasted clarity, ensuring that images were captured under optimal conditions.
By integrating these smart flight techniques, the project generated high-fidelity datasets with minimal noise and maximal learning potential. The result? Better annotations, more consistent segmentation, and AI models that performed well across unseen field conditions.
🔗 Interested in how remote sensing affects yield prediction? See this article from Agronomy.
Building a Robust Labeling Schema for Plant Health 🌾
Annotation wasn’t just about drawing boxes—it involved designing a custom agricultural taxonomy grounded in plant science. Through collaboration with agronomists, we defined a labeling schema that included:
- Healthy Corn Canopy
- Chlorosis/Pale Green Areas
- Necrotic Tissue
- Weed Presence
- Waterlogged Zones
- Bare Soil
- Mechanical Damage
Each image was divided into overlapping tiles, then annotated using polygon segmentation to preserve spatial precision. Importantly, each label was mapped to an agronomic indicator, ensuring that the final AI model could make decisions rooted in biological relevance.
🔗 For a deeper dive into agronomic image classification, see this review on remote sensing for crop phenotyping.
Seasonal Variation and Temporal Labeling Challenges 🌤️
One of the key hurdles in agricultural annotation is seasonal change. Corn plants look drastically different at V6 (six-leaf stage) compared to R1 (silking). Thus, labeling had to be stage-aware. For example:
- Yellowing at early stages may indicate nitrogen deficiency
- Yellowing near harvest might be completely normal (senescence)
To handle this, annotators were trained to reference phenological calendars and work alongside time-stamped crop reports. We also embedded temporal metadata (growth stage, recent rainfall, fertilizer application) into each image batch to contextualize annotations.
This made the dataset not only spatially accurate, but also temporally relevant—a must for predictive modeling.
Training the AI: Turning Labeled Pixels into Agricultural Insight 🧠🌽
Once annotated, the images powered a semantic segmentation model based on a U-Net architecture. This model was tasked with classifying each pixel of a drone image into one of the agronomic classes.
To improve generalization across lighting and field conditions, the team:
- Applied data augmentation (e.g., contrast shifts, blur, crop flipping)
- Used multispectral fusion, combining RGB and NDVI layers
- Trained across multiple seasons to improve robustness
Evaluation metrics included:
- IoU (Intersection over Union) per class
- F1-score for key stress indicators
- Field-level accuracy for canopy health prediction
Model performance was particularly strong in detecting chlorosis and necrosis early in the growth cycle, which helped agronomists recommend corrective actions before irreversible yield loss.
Real-World Results: Saving Inputs, Boosting Yield 📈
Thanks to accurate drone-based annotation, the project achieved:
- 21% reduction in nitrogen fertilizer use on monitored plots
- 14% yield increase compared to non-monitored control fields
- Early detection of fungal outbreaks 2 weeks before visible symptoms
- Targeted pesticide application reduced chemical use by 17%
These results weren’t just academic—they led to tangible cost savings and environmental benefits. Farmers appreciated being able to act earlier, apply less, and harvest more.
Lessons Learned from the Field 🧪
Cross-Disciplinary Collaboration is Key
This project succeeded not because of technology alone, but because agronomists, data scientists, and drone operators worked as one team. Every misaligned label or ambiguous image was treated as a chance to improve both the dataset and the model.
Annotation Requires Agronomic Context
Computer vision alone doesn’t know that late-season yellowing might be normal. Incorporating growth stage metadata and seasonal calendars into annotation decisions made the training data far more accurate.
More Data Isn't Always Better
Early in the project, we aimed for volume. But it became clear that high-quality, consistent annotations beat massive datasets with labeling errors. Our best-performing models trained on 30% fewer images, but with more coherent, contextual labels.
What This Means for the Future of Agricultural AI 🌍
he success of this case study represents more than just a one-off innovation—it’s a blueprint for the future of AI-powered agriculture. As climate stress, population growth, and food security challenges converge, scalable solutions like drone annotation and intelligent AI workflows will become mission-critical.
Here’s how this shapes what’s next:
From Reactive to Predictive to Prescriptive
Most farms today still operate reactively—responding to visual signs of crop stress when it may already be too late. With annotated drone data and AI analysis, we can evolve from:
- Reactive: Spotting yellowing crops after damage
- Predictive: Forecasting stress 1–2 weeks ahead
- Prescriptive: Recommending specific actions based on zone-level analysis (e.g., apply 15kg of nitrogen in section D4 only)
This precision enables site-specific recommendations, not blanket treatments—saving costs and protecting the environment.
Autonomous Drones + Edge AI
Future deployments will leverage autonomous drone systems equipped with edge AI chips, allowing real-time processing directly in-flight. This unlocks:
- On-the-fly disease alerts
- In-flight data triaging (e.g., skip healthy zones)
- Drone swarms for large plantations
Combined with 5G or LoRaWAN connectivity, real-time insights can be streamed directly to agronomists or dashboards before the drone even lands.
Expansion to Other Crops and Stressors
While this case study focused on corn, the same methodology applies to:
- Wheat: rust and leaf blight detection
- Soy: canopy closure and nodulation monitoring
- Vineyards: water stress and pest infestation
- Orchards: fruit size estimation and branch-level disease
Each crop brings new labeling challenges and domain-specific taxonomies—but the principles of annotated aerial AI pipelines remain constant.
Integration with IoT, Satellite, and Weather Data
Annotation is just one puzzle piece. The future lies in multi-source fusion, where drone imagery, satellite feeds, soil probes, and weather models converge into a unified AI layer. This holistic view can:
- Predict irrigation needs
- Model pest migration patterns
- Simulate yield under different treatment scenarios
Such integration paves the way toward farm-level digital twins, where every hectare is modeled and optimized continuously.
Democratizing AI for Smallholder Farmers
Most drone-AI solutions are still concentrated in large industrial farms. The next leap is accessibility. With cheaper drones, open-source models, and AI-as-a-service platforms, smallholder farmers can gain access to the same predictive power. This is crucial in regions like sub-Saharan Africa or Southeast Asia, where yield improvements could dramatically reduce food insecurity.
Let’s Build Smarter Fields Together 🚀
If you're working in agtech, remote sensing, or agricultural AI and want to explore how annotated drone imagery can transform your crop management, let’s connect. At DataVLab, we’ve helped AI teams and agronomists build accurate, scalable, and scientifically grounded datasets that truly make a difference on the ground.
👉 Ready to level up your agricultural AI? Get in touch with our experts today.